
What Claude Data is
Claude Data turns questions about your company's data into things you can share. Anthropic's description: "Connect a data warehouse or another app, ask a question in plain language, and Claude writes the queries and builds the result."
Dashboards are one format. The help article lists three others:
- Scrollyteller: scrolling stories built from your numbers
- Visual short: short videos that walk through your numbers
- Visual analysis: written summaries of your numbers
The data comes from two kinds of source. One is a data warehouse, such as Amazon Redshift, BigQuery, ClickHouse, Databricks, or Snowflake. The other is an app you've already connected to Claude. Anthropic's example is a dashboard of your Salesforce opportunities.
You can start from any chat by asking, or from the Artifacts tab by selecting Data and describing what you want. "Everything you create is saved in the Artifacts tab."
Anthropic is specific about what dashboards are for: "Dashboards are made for quick, exploratory questions, like how this week's signups compare with last month's." For deeper analysis, it suggests sending the dashboard to another tool and continuing there.
Who has it, and when it turns on
Claude Data is available on Pro, Max, Ultra, Team, and Enterprise plans. The defaults differ by plan:
- Team: "On Team plans, Claude Data and both beta features are on by default."
- Enterprise: "On Enterprise plans, Claude Data turns on by default on November 19, 2026, unless an owner has already saved a setting, and both beta features are off by default."
Owners manage it in Organization settings > Artifacts, under Templates. Certified queries and live sharing have their own settings under Data, and the admin guide notes that "These settings are hidden when Data is off." On Enterprise, owners can also limit Claude Data to specific groups with custom roles.
Usage is shared with everything else you do in Claude: "Claude Data counts toward your plan's usage limits, like the rest of your work with Claude."
What launched alongside it
Claude Data arrived in the same announcement as two beta products. Anthropic's launch post sums up all three: "Whiteboards is a shared board where your team brainstorms with Claude, Sheets is a spreadsheet Claude builds and edits with you, and Claude Data adds data stories, certified queries, and live sharing."
The same post lists smaller changes to Claude Data itself:
- Design systems. "Design systems are now supported in Claude Data", so dashboards can match your look and feel.
- Tracked changes. Claude Data now records edits "so you can see who has made edits and roll back to a specific version if needed."
- Partners. Anthropic names Amplitude, Mixpanel, Omni, PostHog, and Sigma as partners for Claude Data.
All three products work on web, desktop, and mobile, and the post adds that "Claude Data needs a data connector, such as a warehouse or CRM."
How a chart gets its number
Every chart is a query you can read. Anthropic says: "Claude writes a SQL query for each chart and runs it against your data source. Each chart shows its query, so you can see exactly what it's counting, along with when its data was last refreshed."
That makes checking a number straightforward. Open a chart's query and see how Claude got it. "If it isn't counting what you meant, tell Claude what to change." You can also edit titles, captions, and charts yourself without asking Claude.
Refreshing works on demand, not on a timer: "Claude refreshes a dashboard's data when someone opens it and the data is due for a refresh." The launch post adds that dashboards now support caching, and refresh cadences can be set per dashboard.
Version history
Every change is kept. "Version history shows earlier versions. Edits you make directly appear there too."
To go back:
- Open the dashboard and open its version history.
- Select a version to preview it. The preview is read-only.
- Select Restore.
A restore affects everyone. "The dashboard returns to that version for everyone who opens it, and the restore appears as its own entry in version history." People with view-only access can't edit a dashboard or restore a version.
What certified queries are
Certified queries are the part of Claude Data that remembers how your team defines things. Anthropic's definition: "Certified queries are the official queries your data team has approved. Claude can reuse them when it builds new dashboards. Charts built on certified queries carry a badge."
The launch post describes the problem they solve: your data team can certify the queries everyone should use, "so you don't end up building or working on dashboards with conflicting data."
Where certified definitions come from
There are two routes. "Your data team can certify queries in directly Claude, or use the definitions it already has in dbt, Looker, or Cube (via existing MCP connectors)." And certification isn't limited to admins: "Anyone with write access to a Data artifact can certify."
To certify a query from a chart:
- Open the chart's query and edit it.
- Turn on the Certify query option.
- Add any instructions for Claude, one per line.
- Select Test, then Publish.
"The query shows as certified after a check finishes."
What breaks a certification
Certifications are easy to lose, so treat edits with care. "Editing a certified query removes its certification." To remove one yourself, turn the option off and publish. When that happens, "Dashboards that use that query lose their certified badge."
On the admin side, when owners turn on certified queries, they pick the marketplace and plugin that store them. The admin guide warns: "If you clear that choice, existing certifications go away." If your organization keeps certified queries in a Git-backed plugin, Anthropic says to manage them in GitHub with pull request review instead.
What certification does and doesn't hold
A certified query holds the definition: the SQL and any instructions you added for Claude. It's what Claude reuses for new dashboards. The help article doesn't describe it as holding the discussion that led to that definition, such as why a metric leaves out trial accounts or which edge case changed the count last quarter. If your team relies on that reasoning, it needs to be written down somewhere people and other tools can read.
How live sharing works
Sharing starts closed. "Everything you make in Claude Data starts private to you." To share, open it and select Share. Dashboards can also be shared outside your organization, subject to your plan's sharing settings.
The question live sharing answers is whose data connection a viewer uses. Without it, "a shared dashboard loads its data with each person's own connections." Anthropic's admin guide describes what that means for viewers when live sharing is off: "people who open a dashboard are asked to connect the data source themselves."
With live sharing, "people in your organization can see results from yours, including saved results." Anthropic sets two limits on it: "It's limited to the exact queries the dashboard needs, and those can't change without an editor's approval."
The launch post puts the same rule from the viewer's side: "Viewers see the results of the queries you've approved, and can't run others with your access." ChatGPT Sites handles the same question differently: in supported workspaces, a Site can use each visitor's own connected apps, as our guide to what ChatGPT Sites can carry over from your chats explains.
Turning it on
Open the Sources menu on the dashboard and choose Your access next to each connector. That one choice changes what every viewer of the dashboard sees.
Anthropic's caution is worth repeating in full: "Live sharing runs on your access to the data source. Anyone you share the dashboard with sees those results, even if they don't have access to that source. Check what a dashboard shows before you share it this way."
Access levels
Anthropic's sharing article lists three access levels for artifacts, including dashboards:
- Can view: open the artifact and read its comments
- Commenter: view, plus add comments and download files the artifact offers
- Can edit: commenter, plus make changes
For people you invite from outside your organization, the sharing article adds a limit: "Parts of the artifact that use Claude or your connectors don't work for them."
What Enterprise owners should check before November 19
On Enterprise, Claude Data turns on by default on November 19 unless an owner has already saved a setting. A short checklist before then:
- Decide the default. Save a setting in Organization settings > Artifacts if you want something other than the automatic change.
- Decide who gets it. Use custom roles if only some groups should build with Claude Data.
- Decide on the betas. Certified queries and live sharing stay off by default on Enterprise. Turn them on deliberately.
- Pick where certified queries live. Choose the marketplace and plugin, and don't clear it later unless you intend to remove existing certifications.
- Review sharing outside the organization. Artifacts stay inside the organization by default on Team and Enterprise, and an owner decides whether users can share outside it.
What people try first
Assuming a shared dashboard shows everyone the same numbers. Without live sharing, each viewer loads data with their own connections.
Turning on live sharing without checking the dashboard. It runs on your access, and viewers see the results even without access to the source.
Editing a certified query to fix a typo. Editing removes the certification, and dashboards using it lose their badge.
Expecting dashboards to refresh on a schedule. They refresh when opened and due. Set a refresh cadence per dashboard if you need one.
Treating the certified badge as the full story. Anthropic describes it as the approved query and its instructions, not the reasoning behind the definition.
The Fix: Share data in Claude without surprises
Step 1: Read the query behind each chart
Open the query and confirm it counts what you mean before anyone else sees the chart.
Step 2: Certify the definitions people should reuse
Have your data team certify the queries for metrics that keep coming up, with instructions for Claude.
Step 3: Choose the connection model on purpose
Leave live sharing off if viewers should use their own access. Turn it on only for dashboards whose results everyone may see.
Step 4: Write down the reasoning
Record why each key metric is defined the way it is, which edge cases changed it, and who decided. Keep that next to the work, not only in a chart.
Setting this up in MemoryLake
Certified queries capture what a metric counts. The decisions around it, such as why trials are excluded or why the revenue figure moved last quarter, are context your team uses in many places besides a dashboard.
MemoryLake is a memory layer for that kind of working context, such as metric definitions in plain language, the decisions behind them, and the people who own them, kept in one place you maintain and available to the assistants you connect, such as ChatGPT, Claude Code, and Codex.
You write the entries yourself, in your own words. Nothing is read out of, written to, or deleted from your Claude account, your dashboards, your certified queries, your data connectors, your warehouse, or any vendor's store. Claude Data, certified queries, and live sharing work the way Anthropic describes them.
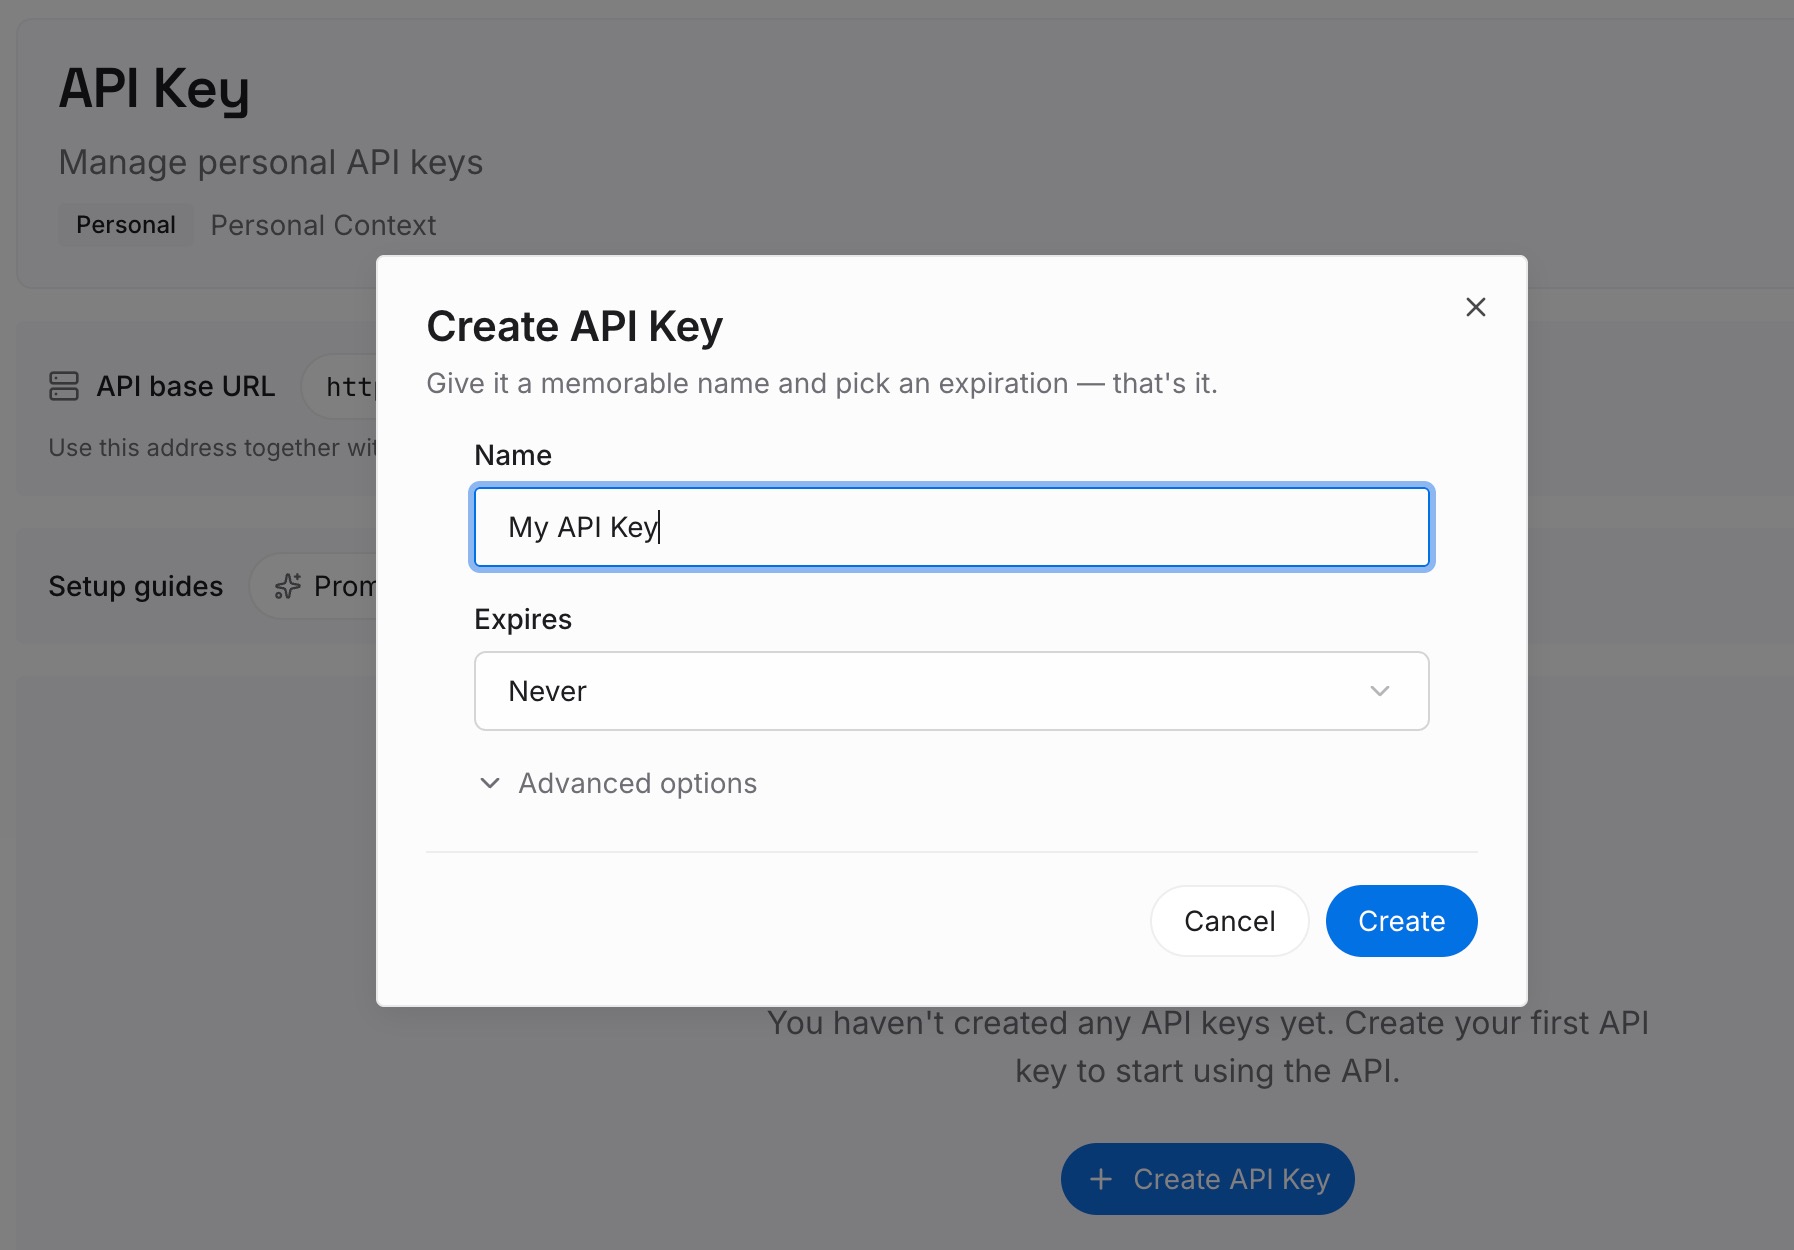
Step 1: Create an API key
Sign in and generate a key from the dashboard. The key belongs to your MemoryLake workspace and is separate from your Claude account and your data connections.
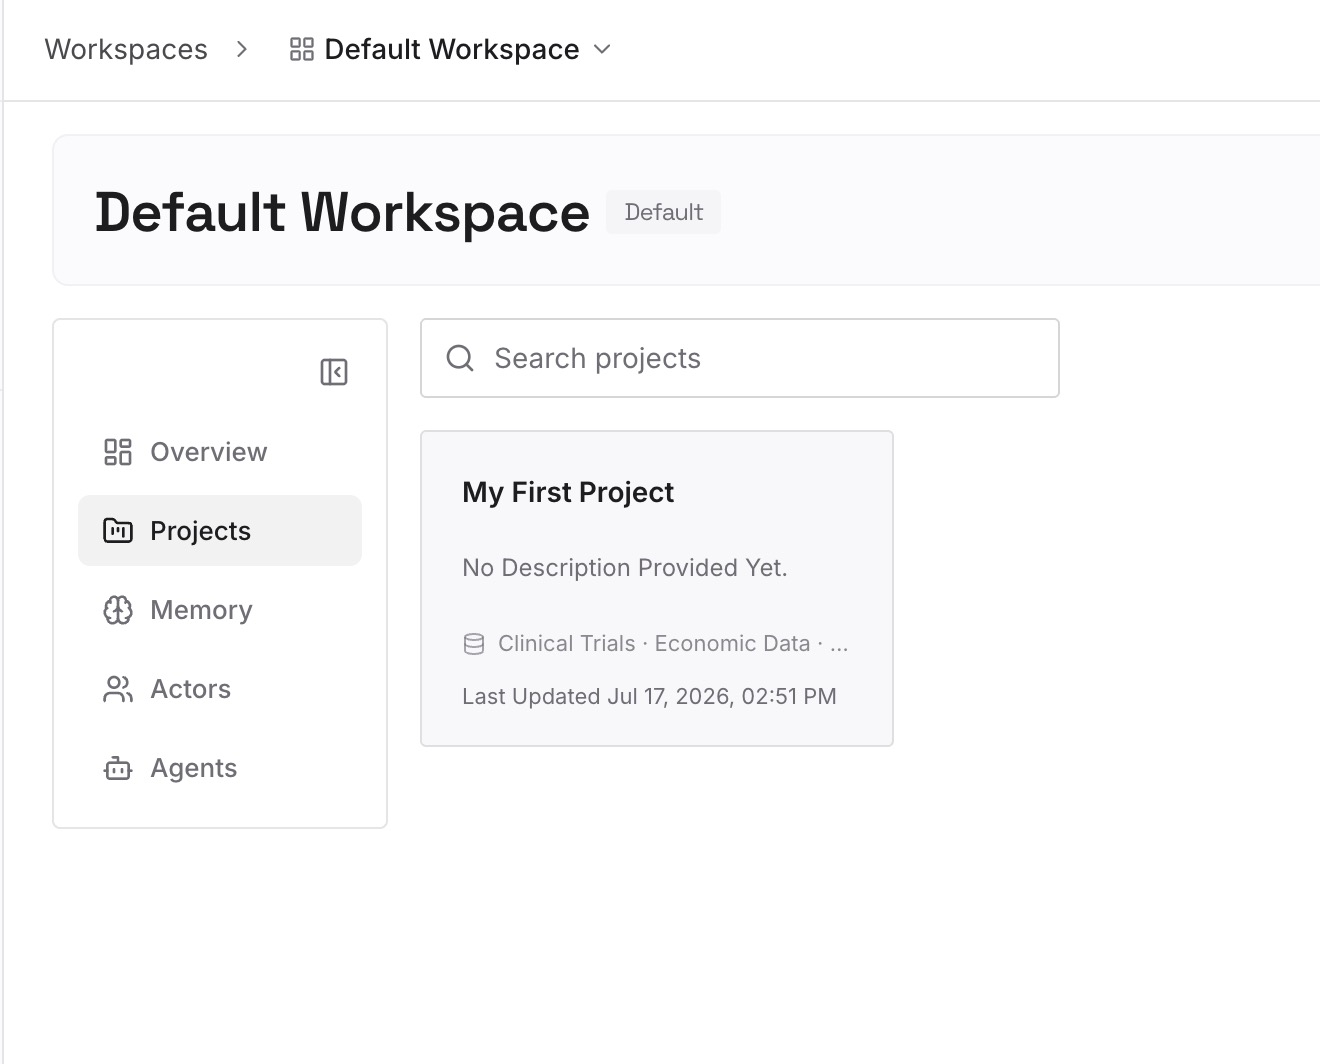
Step 2: Upload your first memories
Start with what you wrote in Step 4 of the fix: each key metric in plain language, why it's defined that way, and who owns it. One item per entry, with no credentials or raw data.
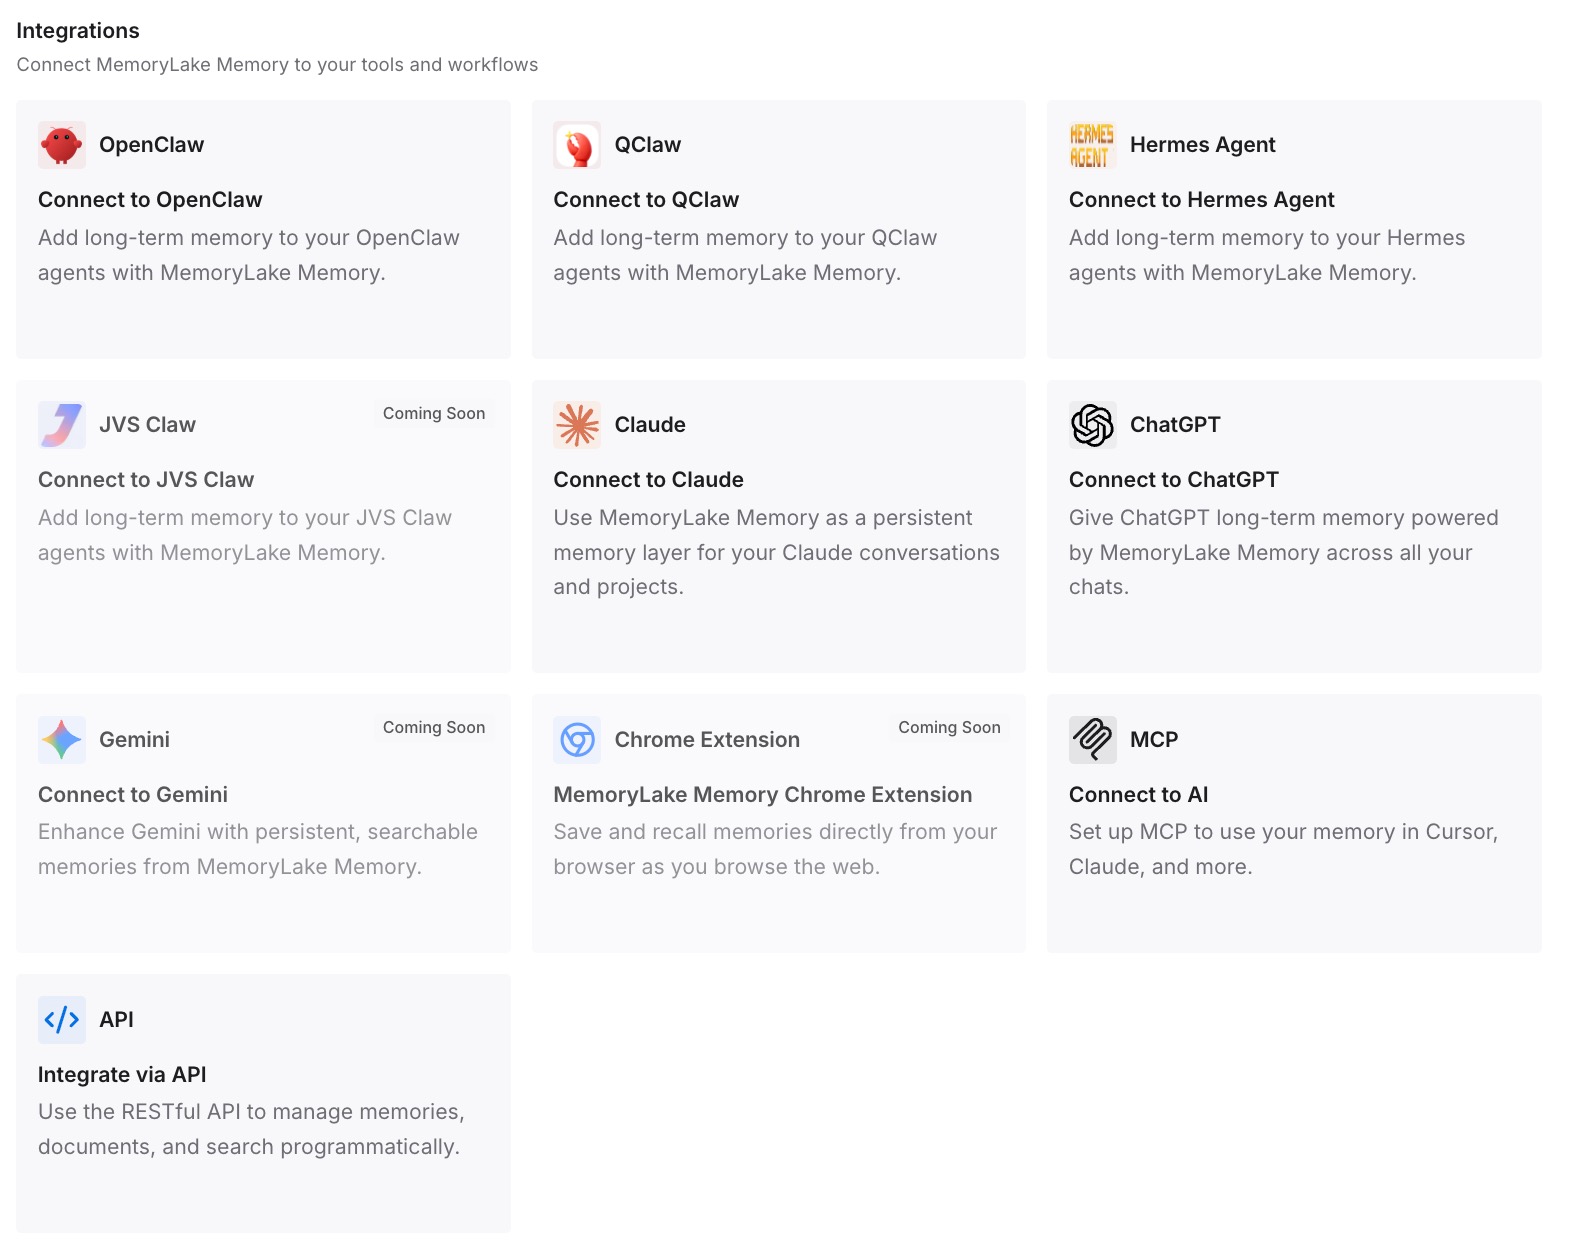
Step 3: Connect your AI & agents
Connect Claude Code, ChatGPT, and any other assistants you use. When someone asks about a metric in another tool, the same explanation is available there.
What this changes in practice
The first difference is one explanation per metric. The reasoning is written once, not rediscovered in each conversation.
The second is a clearer split of jobs. Claude Data holds the approved query, and your entries hold why it's the approved query.
The third is context that travels with the work. When analysis moves from a dashboard into code or a report, the definitions come along in your own words.
Best practices for Claude Data
Check every chart's query. Each chart shows what it counts and when it was last refreshed.
Certify the metrics people reuse. Claude can reuse certified queries for new dashboards.
Don't edit a certified query casually. Editing removes its certification.
Treat live sharing as sharing your access. Viewers see results even without access to the source.
Use version history before rebuilding. A restore changes the dashboard for everyone.
On Enterprise, save a setting before November 19. Otherwise Claude Data turns on by default.
Write down why, not only what. Keep the reasoning behind definitions where people and tools can read it.
Conclusion
Claude Data is the generally available version of Claude Dashboards. It builds dashboards and data stories from your warehouse or connected apps, and every chart shows the SQL behind it. Certified queries let your data team approve definitions that Claude reuses for new dashboards, and editing one removes its certification. Live sharing lets colleagues see results from your connection, limited to the dashboard's approved queries, so check what a dashboard shows before you turn it on.
On Team plans, Claude Data and both betas are already on. On Enterprise, Claude Data turns on by default on November 19 unless an owner has saved a setting, and the betas stay off until someone enables them. Whatever you decide, keep the reasoning behind your key metrics written down outside a single chart.